Driving Retail Information Architecture with the Databricks Medallion Architecture
Information architecture within the Information Layer is what transforms a company’s raw data into a single, trusted system of record that fuels knowledge work across every business function. By organizing and governing how data is modeled, related, and exposed through APIs, the Information Layer ensures that every team—from operations to finance to marketing—works from the same version of the truth. This eliminates costly data silos and reconciliation cycles, enabling faster, more confident decision-making. Instead of spending time finding or cleaning data, knowledge workers can focus on using it to capture revenue, optimize performance, and respond to market shifts in real time.
For next-generation data platforms, strong information architecture is the linchpin between cloud-scale infrastructure and AI-driven business productivity. As reasoning systems like large language models (LLMs) become standard tools, their accuracy and usefulness depend entirely on the structure and clarity of the underlying data they consume. A well-designed Information Layer provides the semantic and contextual backbone that allows these systems to reason effectively over enterprise data, enabling conversational analytics, automated insights, and intelligent workflows. In short, it converts technical investment into tangible business value by ensuring that every byte of data serves a strategic purpose in advancing knowledge work and organizational growth.
To provide the knowledge work layer (e.g., "BI tools", "LLM-based applications", "Agents") with the correct information (not raw data), we need a strategy to organize the data. This is where the Medallion Data Architecture enters the picture.
The Medallion Data Architecture
The Medallion data architecture can be utilized to convert raw time series retail data into structured tables of transactions, products/inventory, and margins. Then analytical tables can be generated from the structured tables for querying business health, product popularity, profitability, and other KPIs. For modern retail and operations teams, this approach transforms messy, disparate data sources into a streamlined engine for analytics. By systematically curating data through Bronze, Silver, and Gold layers, retailers can build a single source of truth that empowers everyone in the organization, from the C-suite to store managers., as seen in the diagram below.
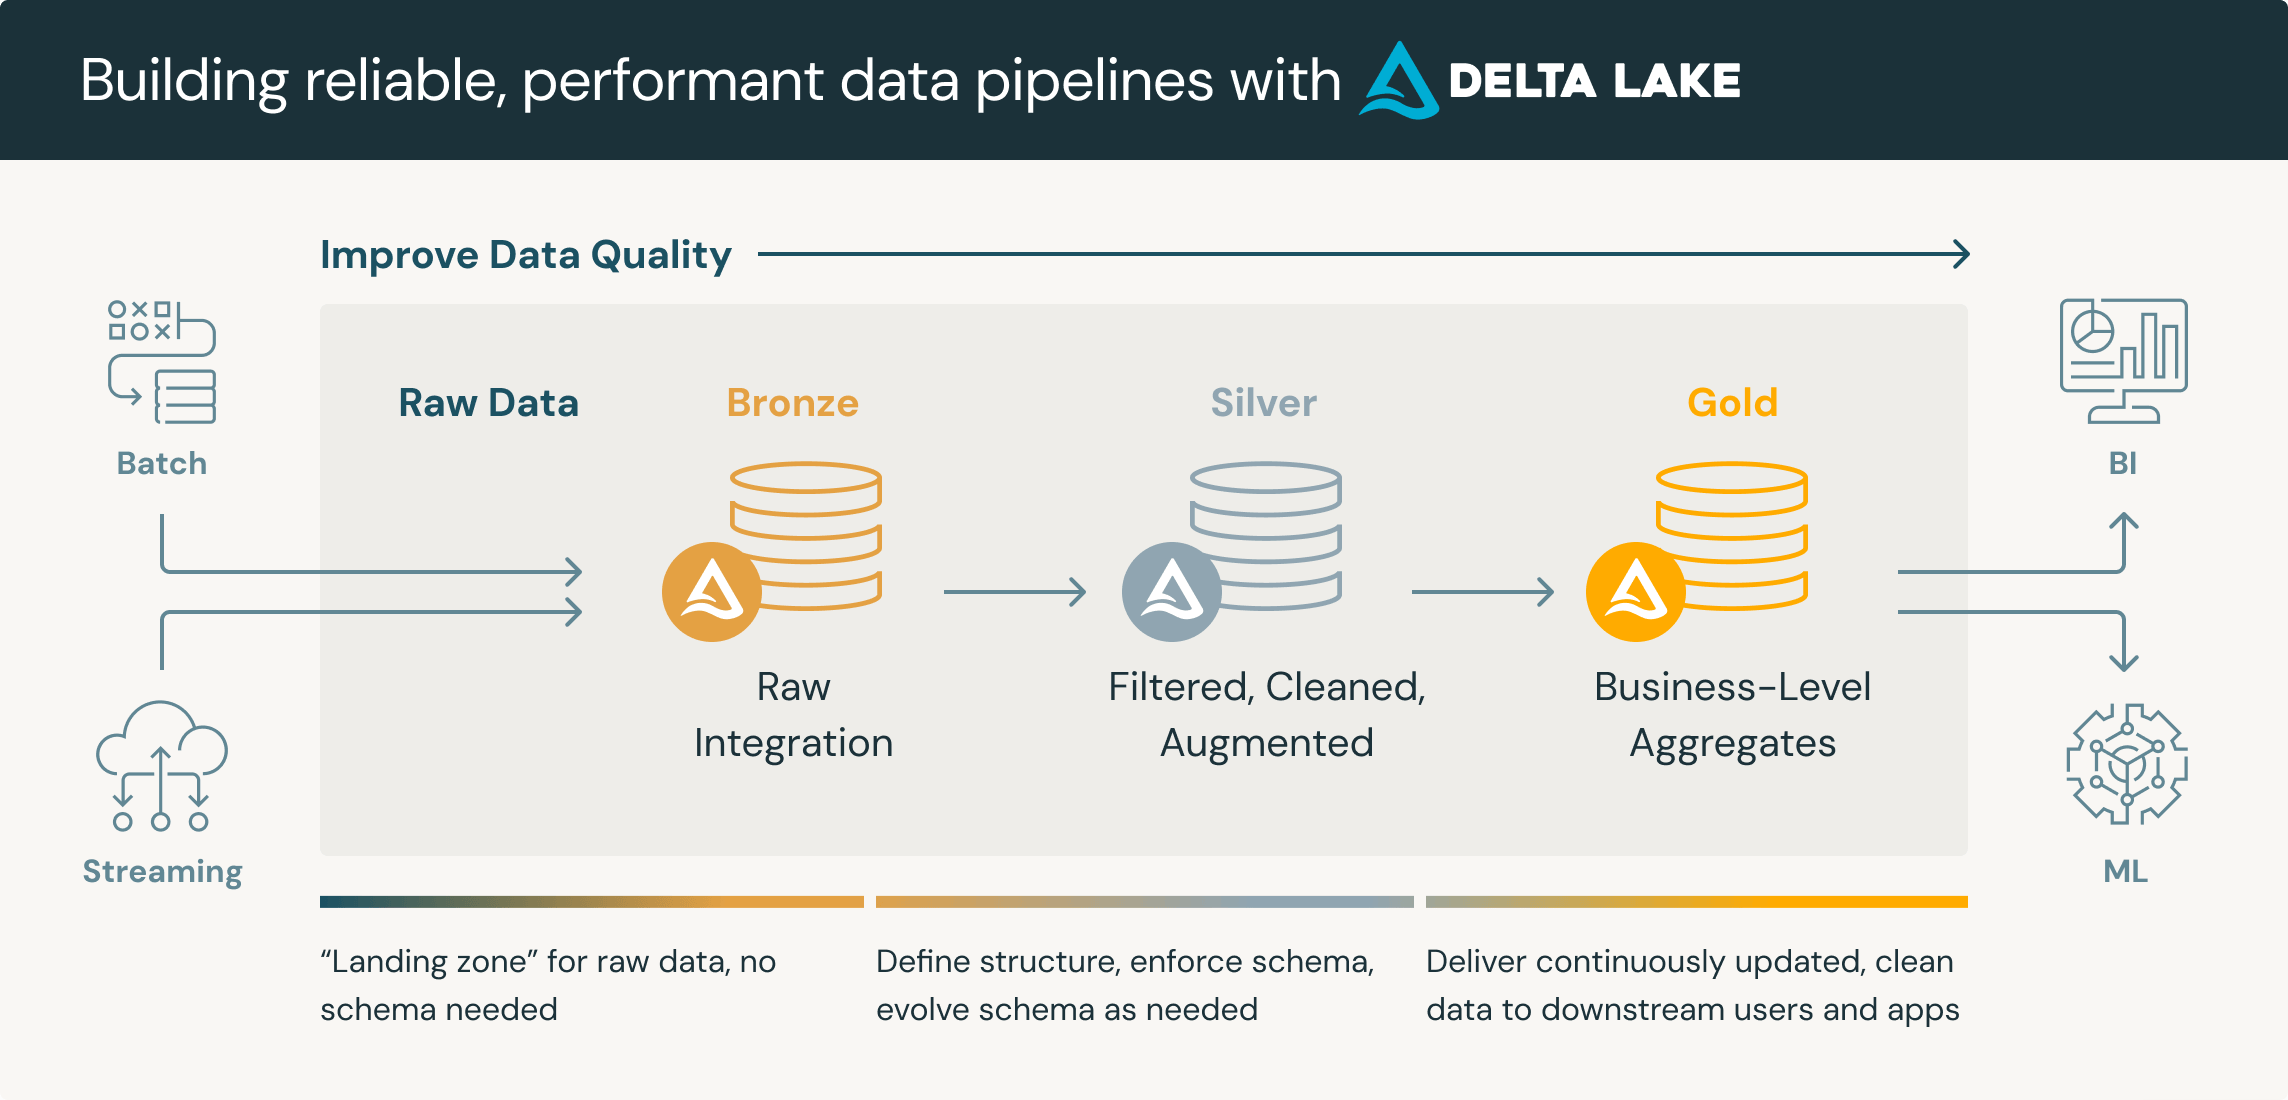
📘 Reference: Medallion Architecture, Source: databricks.com
The Medallion pattern organizes data within our big_cloud_dealz_development Databricks environment into three distinct layers, each with a specific purpose.
- Bronze
- Silver
- Gold
Note that on the Databricks Unity Catalog system our catalog would be big_cloud_dealz_development and each layer would be mapped to a different schema (e.g., silver) inside the catalog, each schema containing a set of Delta tables.
Think of this organization strategy for data layers as refining raw ingredients into a gourmet meal. To make the medallion data architecture more real, let's consider what a mythical retail named "Big Cloud Dealz" might do when building out a data lakehouse on the Databricks platform with Delta tables. For the sake of brevity we're going to only consider the logistics division of the retail company for this exercise.
The bronze layer would contain tables that meant to land incoming log data from outside systems such as ERP systems, or from multiple systems of the same type (e.g., "point of sale systems") that need to be aggregated.
The silver layer contains the following tables for the logistics division:
- dim_locations
- dim_suppliers
- dim_products
- dim_carriers
- ref_lane_sla
- fact_shipments
- fact_shipment_receipts
- fact_sales_forecast
- fact_inventory
- fact_inventory_backorder
- fact_po_header
- fact_po_line
And then in the gold layer, they would have:
- metric_view_transit_sla_percent
- metric_view_carrier_delay_hours
- metric_view_lead_time_variance
- metric_view_stockout_exposure
Now, these tables are views are not exhaustive of what a logistics division would need, but its a good place to start to talk through the Medallion Data Architecture in retail. Let's take a look at each layer and how its used.
Bronze Layer (Raw Ingestion) 🥉
This is the landing zone for all source data in its original, untouched format. For our retail operations, this includes raw JSON feeds from supplier WMS systems, CSV exports from our ERP (containing purchase order data), and EDI logs from carriers. The primary goal for the Bronze layer is to load the data quickly into Delta tables (e.g., bronze.erp_po_export, bronze.wms_shipping_log) and archive it. It's crucial not to place any business logic in this layer, as its only job is to capture the raw data from the source systems.
Silver Layer (Modeled & Cleansed) 🥈
Next, we clean the data and model it into a star schema with dimension and fact tables. Note the use of dim_ and fact_ prefixes.
Here, the raw Bronze data is transformed into a clean, structured, and queryable data warehouse. Data is deduplicated, conformed to common standards (like aligning timestamps and IDs), and modeled into a robust schema representing the core business entities and events.
Dimension Tables are created to provide conformed business context. This includes tables like silver.dim_products (storing SKU information, including supplier_id and category), silver.dim_carriers (standardizing carrier names and mode), and silver.dim_locations (a master list of all stores and warehouses).
In the SQL code examples below we give the table creation statements for 2 of the tables in our the silver schema, dim_products and dim_carriers.
CREATE TABLE IF NOT EXISTS big_cloud_dealz_development.silver.dim_products (
  sku_sk                BIGINT    GENERATED BY DEFAULT AS IDENTITY,
  product_id            STRING    NOT NULL,
  supplier_id           STRING    NOT NULL,
  category              STRING,
  brand                 STRING,
  product_name          STRING,
  product_type          STRING,
  target_audience       STRING,

  unit_cost     DECIMAL(18,2) DEFAULT 0,
  unit_price    DECIMAL(18,2) DEFAULT 0,
  weight_lbs    DECIMAL(18,2) DEFAULT 0
) USING DELTA;
CREATE TABLE IF NOT EXISTS big_cloud_dealz_development.silver.dim_carriers (
  carrier_sk    BIGINT   GENERATED BY DEFAULT AS IDENTITY,
  carrier_id    STRING   NOT NULL,              -- business key (e.g., SCAC or vendor id)
  carrier_name  STRING,
  scac          STRING,
  mode          STRING,                          -- PARCEL/LTL/FTL/INTERMODAL
  is_active     BOOLEAN  NOT NULL DEFAULT TRUE,
  valid_from    TIMESTAMP NOT NULL DEFAULT current_timestamp(),
  valid_to      TIMESTAMP,
  is_current    BOOLEAN   NOT NULL DEFAULT TRUE
) USING DELTA;
Fact Tables capture business events and metrics. This is where we build out core tables like silver.fact_po_header and silver.fact_po_line (tracking all items ordered from vendors), silver.fact_shipments (logging all carrier movements), and atomic inventory tables like silver.fact_inventory (daily on-hand snapshots) and silver.fact_inventory_backorder.
Reference Tables like silver.ref_lane_sla are also established in this layer to store business rules, such as shipping times, which are vital for downstream analysis.
Gold Layer (Business-Ready & Aggregated) 🥇
The Gold Layer is the consumer-facing storefront of the data warehouse. This is where the data completes its journey from raw material to a high-value business asset. While the Silver layer provides a clean, queryable foundation, the Gold layer is crafted for end-user consumption. It consists of aggregated, optimized tables and views designed to power specific analytics, answer critical business questions, and drive strategic decisions. These Gold assets serve as the direct, trusted source for BI tools, dashboards, and KPI reports used by every retail department.
These tables and views are aggregated and optimized for performance, answering specific business questions and powering the dashboards used by our logistics, merchandising, and finance teams.
One example is the gold.view_lead_time_variance_days_by_date. This view consumes the cleaned silver.fact_shipments table to calculate a specific, high-level KPI (shipping time variance) used by the COO to monitor carrier consistency.
Other Gold assets are built by joining multiple Silver tables to answer complex questions. For instance, an OTIF analysis would be built here by joining silver.fact_po_line (qty_ordered) with silver.fact_shipment_receipts (received_quantity) and silver.fact_shipments (actual_arrival_ts).
Similarly, a Stockout Risk report would be created in the Gold layer by comparing inventory levels from silver.fact_inventory against future demand from silver.fact_sales_forecast, enriched with product details from silver.dim_products.
The Gold Layer is the Information Layer for Knowledge Work
In an era of knowledge work, the gold layer is the information (not raw data) that is actually usable to the people performing cognitive labor in an organization.
The gold layer is an implementation of our abstract "information layer" in our Knowledge Work Architecture model.
Powering Core Retail Groups with Gold-Layer Analytics
The true value of the Medallion architecture is realized in the Gold layer, where data is tailored to the specific needs of each business function. Curating an efficient and complete set of views and metric views in the gold layer is critical to empowering modern knowledge work. By creating curated, aggregated datasets, retailers can directly power the key performance indicators (KPIs) for each department.
Operations and Logistics
The Chief Operating Officer oversees the entire supply chain. The Gold layer provides critical visibility into operational efficiency and potential disruptions. The example tables for the architecture focus on this area and are referenced.
- Stockout Exposure: An alert-driven table that identifies products at risk of going out of stock based on current sales velocity and inventory levels. This Gold table would join real-time inventory counts against the
silver.dim_productstable to provide details on at-risk SKUs, brands, or suppliers. - On-Time In-Full (
OTIF): An aggregated view of supplier and carrier performance. This KPI would be calculated by joining shipment facts againstsilver.dim_carriers(to measure carrier performance by mode orcarrier_name) andsilver.dim_products(to measure supplier performance viasupplier_id). - Carrier Delays: A dashboard monitoring the performance of shipping partners to identify and mitigate delivery bottlenecks. The
gold.view_lead_time_variance_days_by_dateview is a prime example of this, as it directly calculates the statistical variance in carrier lead times, allowing the COO to spot inconsistent partners.
Sales
The head of sales will be looking at their KPI metrics in their sales BI dashboard each day to make adjustments to day-to-day sales motions. Some of the key metrics they would want produced in the gold layer would be:
- Net Sales vs Plan: An aggregated view that compares actual sales figures against forecasted targets, updated on any time interval.
- Comp Sales %: A metric view calculating the growth of sales in stores that have been open for a year or more.
- Gross Margin %: A summarized table showing profitability by SKU, product category, brand, or store.
Merchandising
The head of merchandising will be constantly trying to understand what is being sold and where so they can choose the best product mix to meet future needs. Some of the key metrics they would want produced in the gold layer would be:
- GMROI: A pre-calculated KPI that shows how much gross margin is earned for every dollar invested in inventory.
- Sell-Through Rate: A weekly or monthly report that tracks the percentage of inventory sold for specific products or categories.
Marketing
Our Chief Marketing Officer knows the value of low-latency information so they are keen to get the latest KPIs generated from the Databricks data lakehouse. Some of the KPIs they will want in the gold layer include:
- ROAS: A view that joins marketing campaign spend with sales revenue to calculate ROI on marketing investments and customer acquisition costs (CAC).
- Predicted Customer Lifetime Value: A data science model output that scores customers on their potential future value, enabling targeted marketing efforts.
- Retention & Repeat-Purchase Health: Dashboards showing customer cohort behavior and repeat purchase rates over time.
Practical Design Tips for Retail Data Warehousing
A successful Medallion architecture relies on strong governance and consistent design patterns. Following a clear naming convention is one of the most effective ways to ensure the data warehouse is easy to navigate, maintain, and use.
Key Governance Rules: Dos and Don'ts
- ✅ Do align fiscal calendars and currency definitions before publishing KPIs to ensure consistency across all reports.
- ❌ Don't join fact tables on natural keys (like a product SKU) in BI tools. Always use surrogate keys (
_sk) for stable and performant joins. - ✅ Do version plans and forecasts. Incorporate fields like
scenarioorversion_tsto track changes and perform predictive analysis. - ❌ Don't ever put complex transformation or business logic in the Bronze layer. It should remain an unaltered archive of the source data.
In the next article I'll further develop out the gold layer for this retail Medallion Data Architecture with examples of how to build metric views.
Next in Series
Building a Retail Semantic Layer with Unity Catalog Metric Views
This article explains how Databricks Unity Catalog Metric Views create a governed semantic layer that transforms complex retail data into consistent, business-ready insights—empowering teams to accelerate knowledge work and make revenue-driving decisions with confidence.
Read next article in series