Building a Standard Claims Data Model With the Cube Semantic Layer and Databricks
Effective claims data modeling is essential for empowering the claims team to make informed, high-quality decisions. By implementing a robust data model through a semantic layer, like Cube, insurance companies can create a unified, consistent foundation for their data. This model bridges the gap between raw data and business intelligence tools, such as Power BI or Tableau, enabling the Chief Claims Officer to better forecast potential losses, optimize cash flow management, and make strategic decisions. With features like real-time query performance, integration with Excel, and secure authentication, the right data model ensures the claims team has reliable, actionable insights, driving improved decision-making and business outcomes.
In this article I'm going to take you through how to model the bordereaux claims data we've ingested into our Databricks data table with the Cube semantic layer. The advantage here will be that we're providing standardize and complete information in our Information Layer for the knowledge work in the claims division.
Towards a Standard Claims Data Model
The Cube semantic layer enhances knowledge workflow efficiency by offering a unified, governed data access platform that ensures consistent, trustworthy models and metrics across the organization. One advantage of Cube is that it integrates seamlessly with tools like Power BI and Excel, enabling faster, more reliable query performance and reducing common errors from SQL translations. With features such as the Cube DAX API and enterprise-friendly authentication (including SSO), Cube not only simplifies data consumption but also accelerates decision-making by providing a single source of truth. This makes it a compelling choice for improving data accessibility and supporting impactful business decisions in a dynamic environment.
Cube, like OLAP systems, organizes data into a multidimensional model that supports efficient aggregation and analysis across various levels of detail.
Key components:
-
Measures
Quantitative values used for analysis, such as:- Totals
- Averages
- Counts
- Ratios
-
Dimensions
Categories used to group, filter, and explore measures, such as:- Time (e.g., year, quarter, month)
- Geography (e.g., region, city)
- Product or business unit
This structure allows users to quickly navigate complex datasets using familiar business hierarchies, enabling deeper and faster insights. We want to provide quality information that is complete and quick to access in our Information Layer up to the Knowledge Work Layer. Let's quickly review the Knowledge Work Architecture concepts before we move on to connecting Cube to our Databricks data lakehouse.
The Information Layer
In the diagram below we see the knowledge work architecture abstractions of the knowledge work layer, the information layer, and the infrastructure layer.
Knowledge Work Layer
- Business processes using information
- People using expertise with information
- Convert information into revenue
Information Layer
- Data model definitions
- Semantic layer
- APIS: SQL, REST, GraphQL
Infrastructure Layer
- Cloud infrastructure
- Databases, ETL pipelines, Servers
- Data Governance, Security
At Patterson Consulting we frame every data platform project and tool in this framework to keep outcomes aligned on impacting the line of business through the knowledge work layer.
Given that the line of busniess tools (Excel, PowerBI, etc) in the knowledge work layer operate on information, not data, we need to build a logical materialized view of the claims information needed (our claims data model) in the information layer.
In this example we are building our materialized view of the bordereaux claims data in the Cube semantic layer. This materialized view of the information needed at the knowledge work layer will be in a low-latency cached system.
Now that we've gotten the background framing out of the way, let's connect the Cube platform to our Databricks data lakehouse.
Connecting Cube to Databricks
Head over to Cube.dev and sign up for a free account to start your first Cube deployment. From there, click on "Create Deployment" on the main account portal and you should see a screen similar to the one below for creating a new deployment.
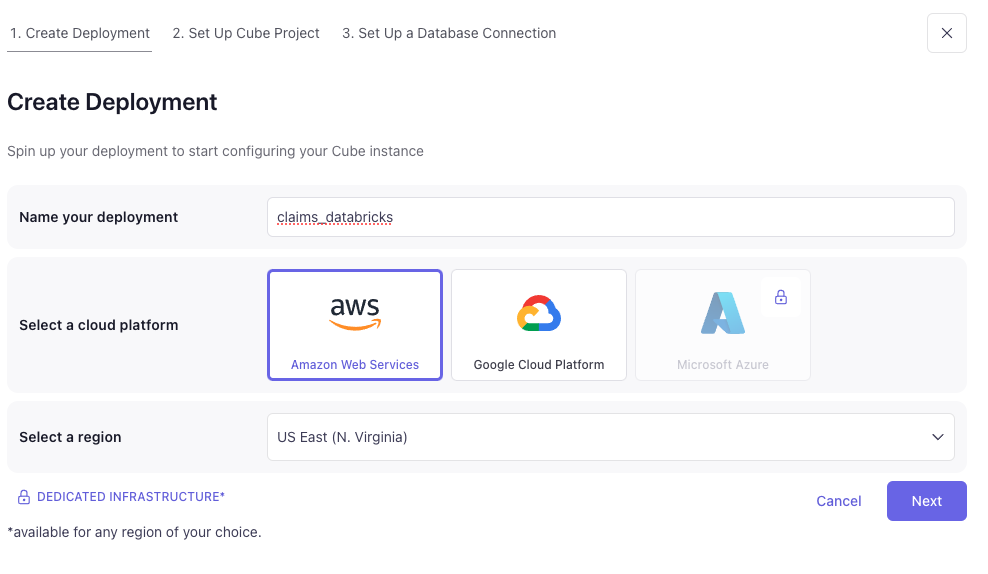
You will need to provide some configuration information from your Databricks workspace such as:
- Databricks JDBC Connection string
- Databricks Personal Access Token
- A default catalog to work from
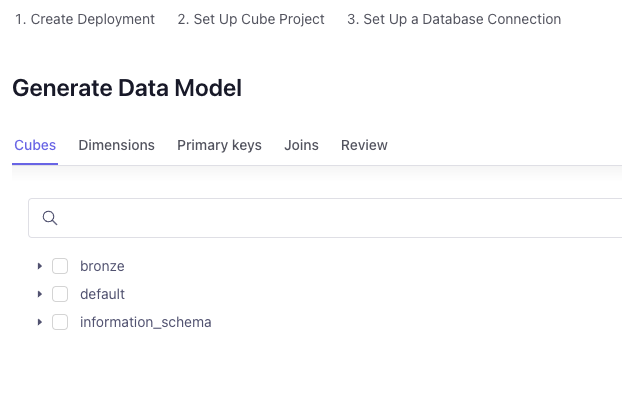
Once you've established connectivity with your Databricks workspace's Serverless SQL Data Warehouse, you can start building out your data model. You can use the visual guide to build a data model (as shown below), but the wasier way will be to just skip this part and use the data model definition we include as part of this series once your deployment is completely set up.
Once you are beyond the visual data modeling UX screen and your deployment is ready, you should see a screen similar to the one below.
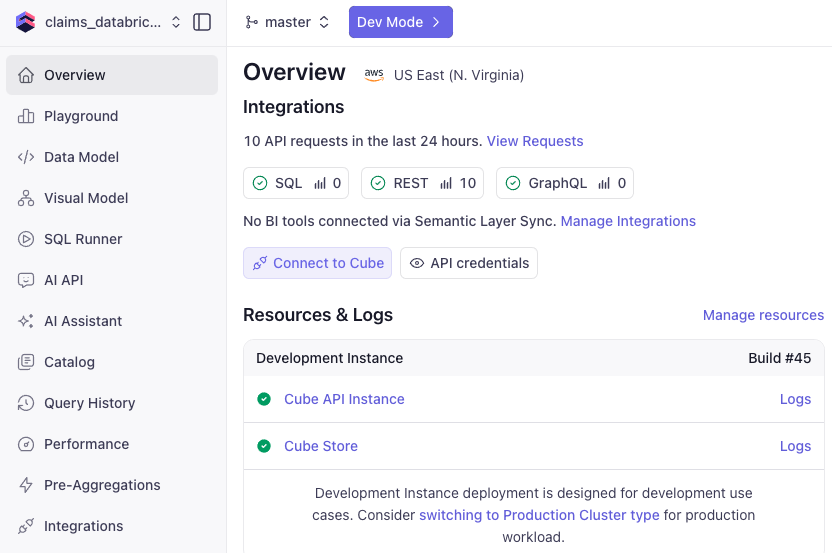
You are now to start building out data models over your Databricks delta lake tables.
Our Claims Data Model
To define a standardized claims model I want to start with a list of areas we want to cover in this data model. The list of areas of the claims data model are listed below.
- Claims Summary at Current
- KPIs
- Claims Lag
- FNOL Reported by Month
- Aged Pending
- No Reserve
- Reserve Change
- Large Loss
- Open to Reported & Case Reserve by Age
- CAT Claim Summary
- All Claim Summary
If we start with just one of the above parts of our standardized claims data model, we want to build out the "claims summary at current" part. This part of the data model is defined as "A comprehensive snapshot of all active claims at any specific point in time, showing status, reserves, and key metrics across the entire claims portfolio". The code listing below (also provided on our github repo) is how we implement this part of the claims model as part of the semantic layer on Cube.dev.
cubes:
  - name: claims_summary_current
    sql: SELECT * FROM claims_workspace.bronze.bordereaux_data
    title: Claims Summary at Current
    description: A comprehensive snapshot of all active claims at any specific point in time, showing status, reserves, and key metrics across the entire claims portfolio.
    joins: []
    dimensions:
    - name: policy_number
      sql: "{CUBE}.policy_number"
      type: string
      description: The policy number of the claims record.

    - name: months_insured
      sql: "{CUBE}.months_insured"
      type: number
      description: The number of months the customer has been insured.

    - name: has_claims
      sql: "{CUBE}.has_claims"
      type: boolean
      description: Whether the policy has any associated claims.

    - name: items_insured
      sql: "{CUBE}.items_insured"
      type: number
      description: Number of items insured under the policy.

    - name: claim_reference
      sql: "{CUBE}.claim_reference"
      type: string
      description: A unique reference for the claim.

    - name: insured_name
      sql: "{CUBE}.insured_name"
      type: string
      description: Name of the insured party.

    - name: policy_start_date
      sql: "{CUBE}.policy_start_date"
      type: time
      description: Start date of the policy coverage.

    - name: date_of_loss
      sql: "{CUBE}.date_of_loss"
      type: time
      description: The date on which the loss occurred.

    - name: date_reported
      sql: "{CUBE}.date_reported"
      type: time
      description: The date the loss was reported.

    - name: claim_status
      sql: "{CUBE}.claim_status"
      type: string
      description: Status of the claim (e.g., Open, Closed, Reopened).

    - name: loss_type
      sql: "{CUBE}.loss_type"
      type: string
      description: Type of loss associated with the claim.

    - name: paid_amount
      sql: "{CUBE}.paid_amount"
      type: number
      description: Amount paid on the claim to date.

    - name: reserve_amount
      sql: "{CUBE}.reserve_amount"
      type: number
      description: Reserve amount set aside for future payments.

    - name: total_incurred
      sql: "{CUBE}.total_incurred"
      type: number
      description: Total cost incurred for the claim (paid + reserve).

    - name: claim_propensity
      sql: "{CUBE}.claim_propensity"
      type: number
      description: Model-driven score estimating the likelihood of a claim.

    measures:
      - name: count
        type: count

      - name: total_claims
        type: count

      - name: open_claims
        type: count
        filters:
          - sql: "{CUBE}.claim_status != 'Closed'"

      - name: total_reserves
        sql: "{CUBE.reserve_amount}"
        type: sum
        filters:
          - sql: "{CUBE}.claim_status != 'Closed'"

      - name: total_paid
        sql: "paid_amount"
        type: sum

      - name: total_incurred_all
        sql: "total_incurred"
        type: sum

      - name: average_claim_size
        sql: "{CUBE.total_incurred_all} / {CUBE.total_claims}"
        type: number
Here are the steps to update your main branch of your claims data models in your Cube deployment:
- Click on "Data Model" on the left side toolbar
- Click on "Dev Model" at the top, and create a new branch to work from
- Add the file contents above to a new file in the data model file named "claims_summary.yml" via the file toolbar area on the left side
- Save the changes, wait a few seconds, and then merge the changes back into the "master" branch
Most BI tools want to work against a Cube "view", so we've provided a simple view of the claims_summary_current data model as well:
views:
  - name: claims_summary

    cubes:
      - join_path: claims_summary_current
        includes:
          - total_claims
          - open_claims
          - total_reserves
          - total_paid
          - total_incurred_all
          - average_claim_size
Add the above yaml code to the "views" subfolder in your data model and save it.
Once you've merged your updates to your Cube.dev claims data model, you are ready to head over to the Cube.dev "Playground" to test out your data model.
Demo in Cube Playground
Let's run a quick test with our claims data model and generate a quick report on the Companies that generated a loss in the claims data in the past week.
Click on "Playground" in the left hand toolbar in the main Cube deployment dashboard area.
Once in the data model "Playground" part of the deployment you can visually edit test queries for your newly deployed data model. Click on the dimension "insured_name" and the measure "date_of_loss" and select "This week" for the temporal filter. It should look like what you see in the Cube.dev UX image below.
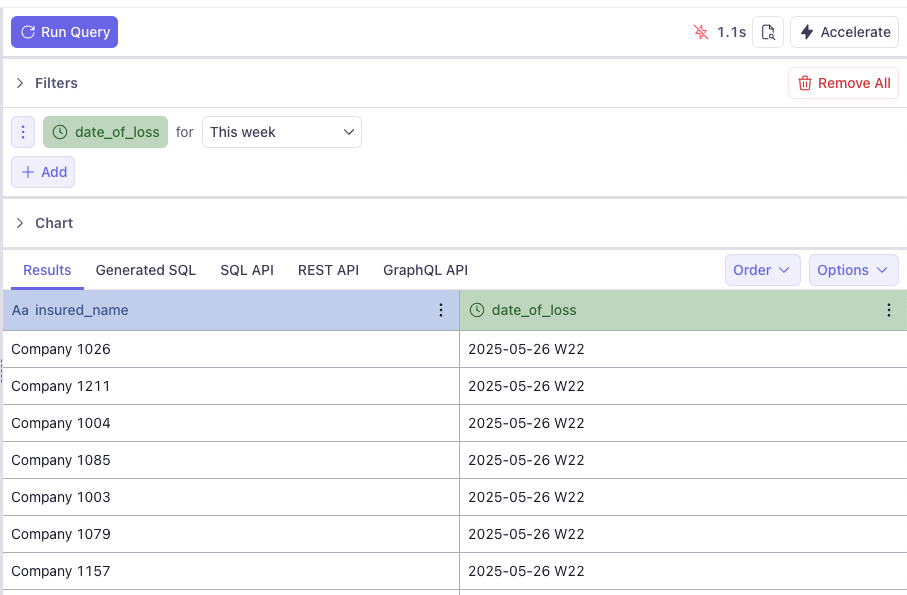
If your query runs and gives results similar to what you see above, congratulations, you now have a claims data model operational for your property insurance data lakehouse. Let's move on to thinking about how to integrate this semantic layer into the rest of our knowledge work tools.
Integration with Knowledge Work Tools
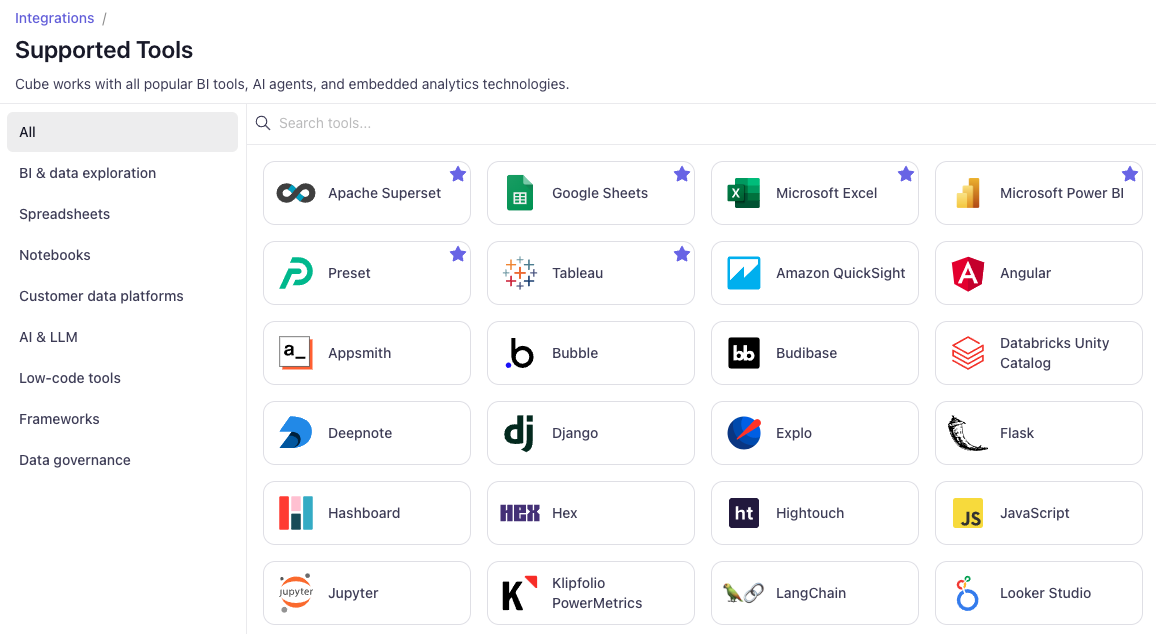
Cube provides out of the box integrations for the following

This allows our data model to efficiently integrate with many of today's core knowledge work tools as shown below.
In the next article, we'll dig into just how to use our data models directly in a Google GSheet.
Next in Series
Connecting to Your Claims Data Model from GSheets with Cube
Quickly using your claims data models in a GSheets spreadsheet with the Cube connector.
Read next article in series