Analyzing Claims Data With the Cube Semantic Layer and Google GSheets
The Claims organization plays a critical role in supplying the Finance team with accurate, timely data on reserves, payments, and claims activity. This information underpins key financial processes, including reserve adequacy, cash flow forecasting, and regulatory reporting. Ensuring seamless data integration between Claims and Finance systems is essential for maintaining financial accuracy, managing solvency risk, and supporting enterprise-wide decision-making.
In this article I'm going to take you through how to use the claims data models we created in the Cube semantic layer inside Google GSheets with the Cube connector. All the processing happens in the cached semantic layer in your data platform making it easier to get consistent complete claims analytical information for running your property insurance business.
The Challenges of the Managing Claims Analytics
Any data platform is relatively straightforward to operate today when everything is in a single application or system. The problem is today's property insurance companies operate with multiple internal systems and multiple external partners. To get a clear idea of what is happening in your company you need:
- complete claims information from multiple sources
- claims information gathered and merged together daily
- data models for claims analytics that are consistent between all tools
The claims data ("bordereaux data") schema is not exact between every partner (TPAs) so this creates overhead for any division trying to make sense of the complete claims analytical picture. Failing to model claims adequately puts the property insurance company at risk for poor cashflow management so companies put a lot of importance on this process. Tracking multiple schemas per partner may be manageable when the partner count is low, but this level of effort quickly rises as you grow and add partners. Automating partner claims schema management is something you'll have to address as the company scales.
Additionally you need to consider that the formulas you are using for your claims analytics calculations may not match what other divisions are using for the same metric in their code. Some effort needs to be spent on some method of metric synchronization between divisions or this creates a situation where calculations may not match when you least can afford or expect it.
In the last article we built our materialized view of the bordereaux claims data in the Cube semantic layer. This materialized view of the information needed at the knowledge work layer is in a low-latency cached system. Now let's use the work we did with a standard claims data model in Cube in an outside knowledge work end-user application, Google GSheets.
Connecting GSheets to a Cube Data Model
To get started first install the Cube Cloud for Sheets extension inside your Google GSheets interface.
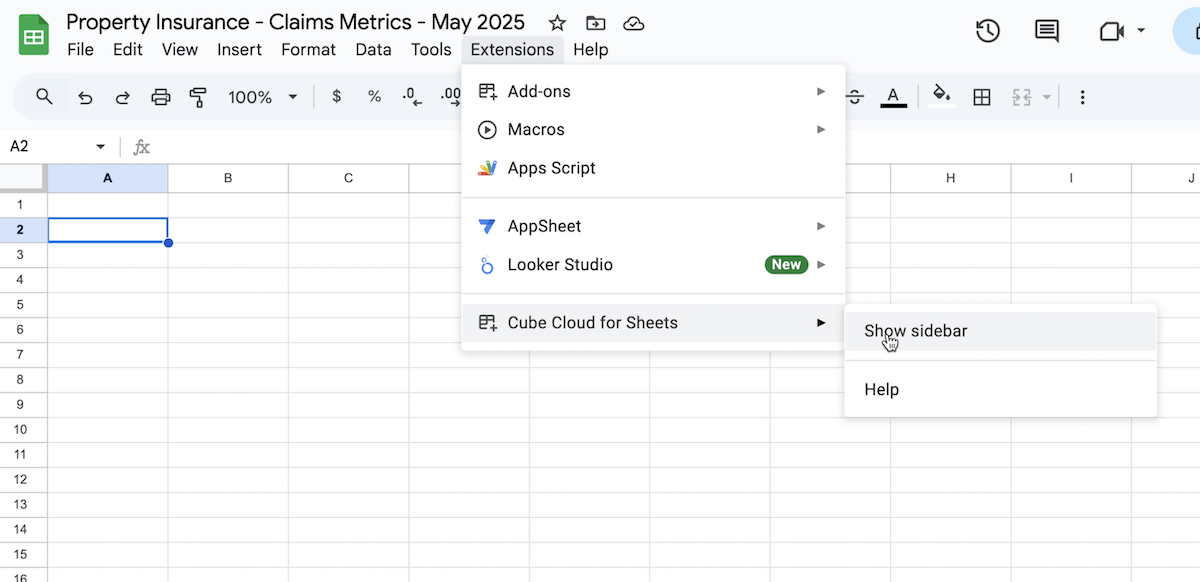
Once the extenstion is installed in GSheets, you want to click on Extensions in the top toolbar in Google GSheets and look for the "Cube Cloud for Sheets" entry as seen in the image below.
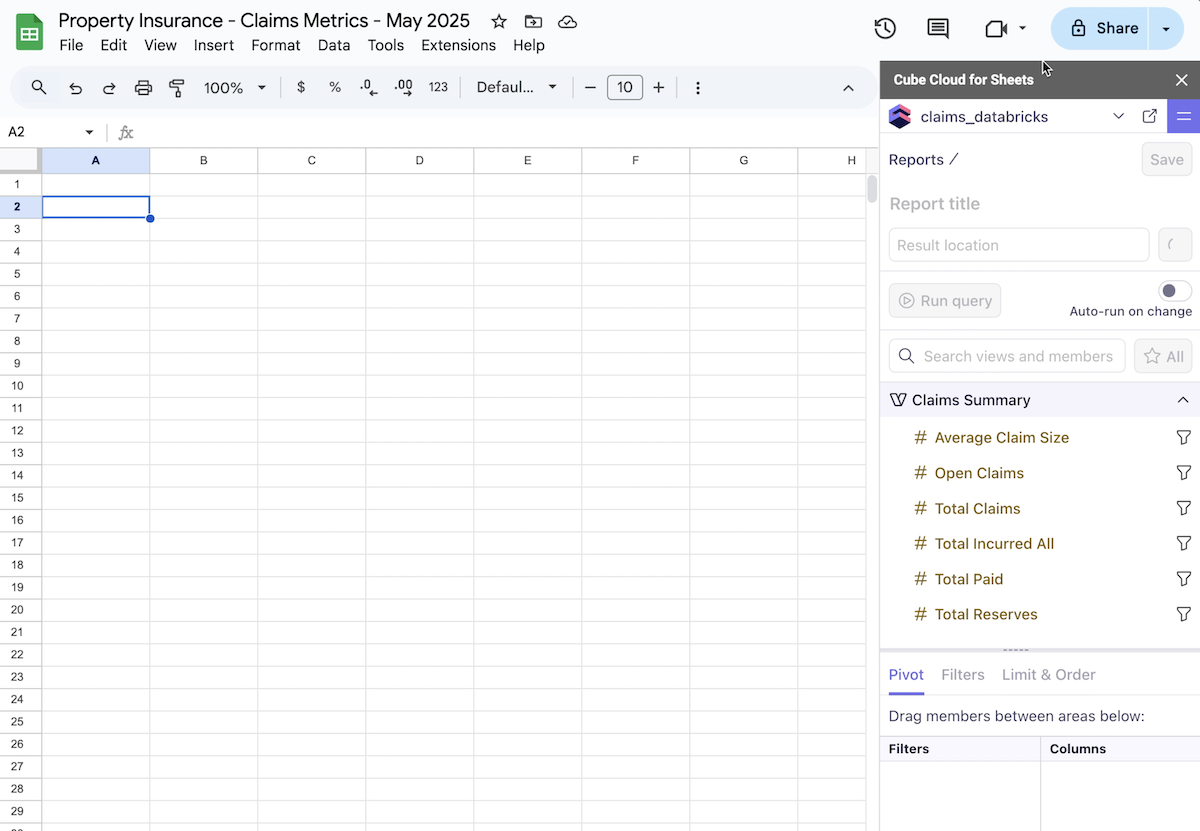
Once you see the Cube extension sidebar (shown in the image below) look for the data model you created in Cube in the top drop down ("claims_databricks" in the image below).
Cubes, Views, and Connecting Applications
You will need a view created with your metrics included in your Cube data model for the metrics to show up in GSheets.
Most BI tools want to work against a Cube "view", so we've provided a simple view of the claims_summary_current data model as well:
views:
  - name: claims_summary

    cubes:
      - join_path: claims_summary_current
        includes:
          - total_claims
          - open_claims
          - total_reserves
          - total_paid
          - total_incurred_all
          - average_claim_size
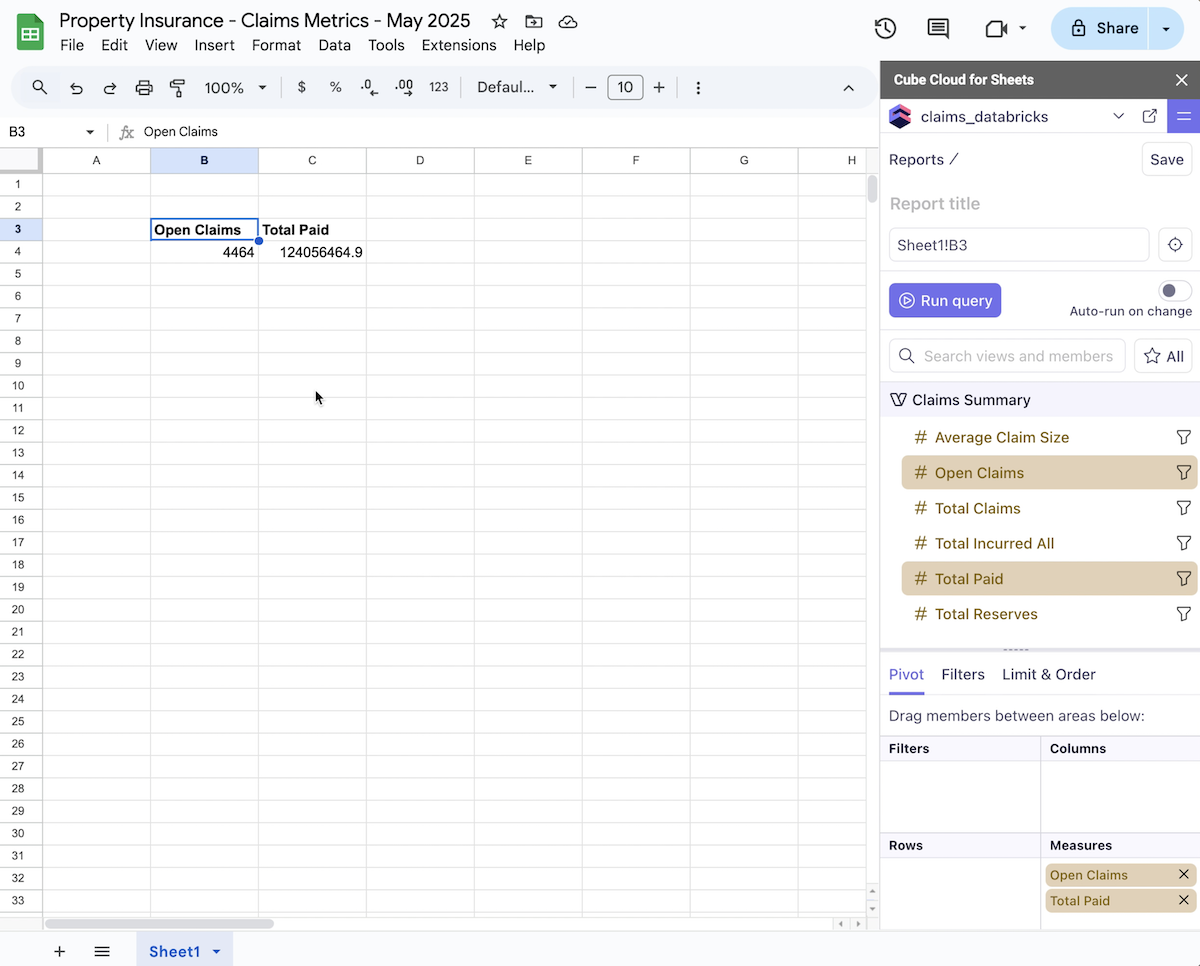
Now that we have our Cube claims data model connected to GSheets, we can begin to use our metrics. Click on a cell in your spreadsheet and then a metrics from your data model, and it will be calculated and automatically populated in the spreadsheet cell. If the source data has changed in the data warehouse, the Cube data model will pick up the change and recalculate the metric for you automatically. You can see both "Open Claims" count and the "Total Paid" total in the spreadsheet image below, where both were calculated from the Databricks SQL data warehouse and then cached in the Cube data model caching layer.
Now your knowledge work end-users have fast access to consistent metric calculations across all divisions in the company.
This saves on both computation cost and costs from errors when calculations don't match up between divisions.
Building business logic in the cached semantic layer making it easier to get consistent complete claims analytical information for running your property insurance business. It saves your company money on both cloud computing costs and also the cost of inconsistency in business metrics between divisions. Next up we'll work through connecting this same claims data model to Power BI to build a dashboard for your claims team.
Next in Series
Understanding the Difference Between Unity Catalog and the Hive Metastore
In this article we give a breakdown of the key differences between the legacy hive metastore and the modern Databricks Unity Catalog.
Read next article in series